Zeroing in on User Insights

Pallavi Thampi
April 11, 2019
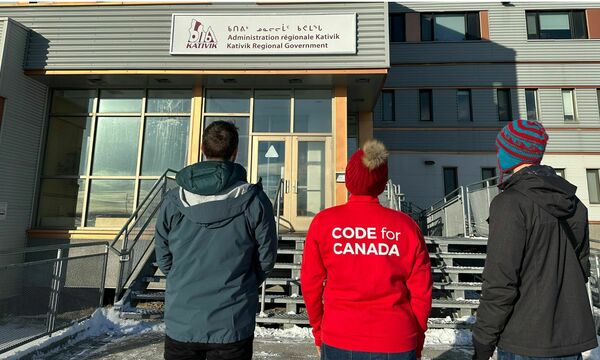
This series follows our journey as a product team through Code for Canada’s nine-month fellowship within the public sector. Andrew Konoff, Evan Savage & myself are embedded within the Big Data Innovation Team in the Traffic Safety Unit. Read Andrew’s intro to the project here.
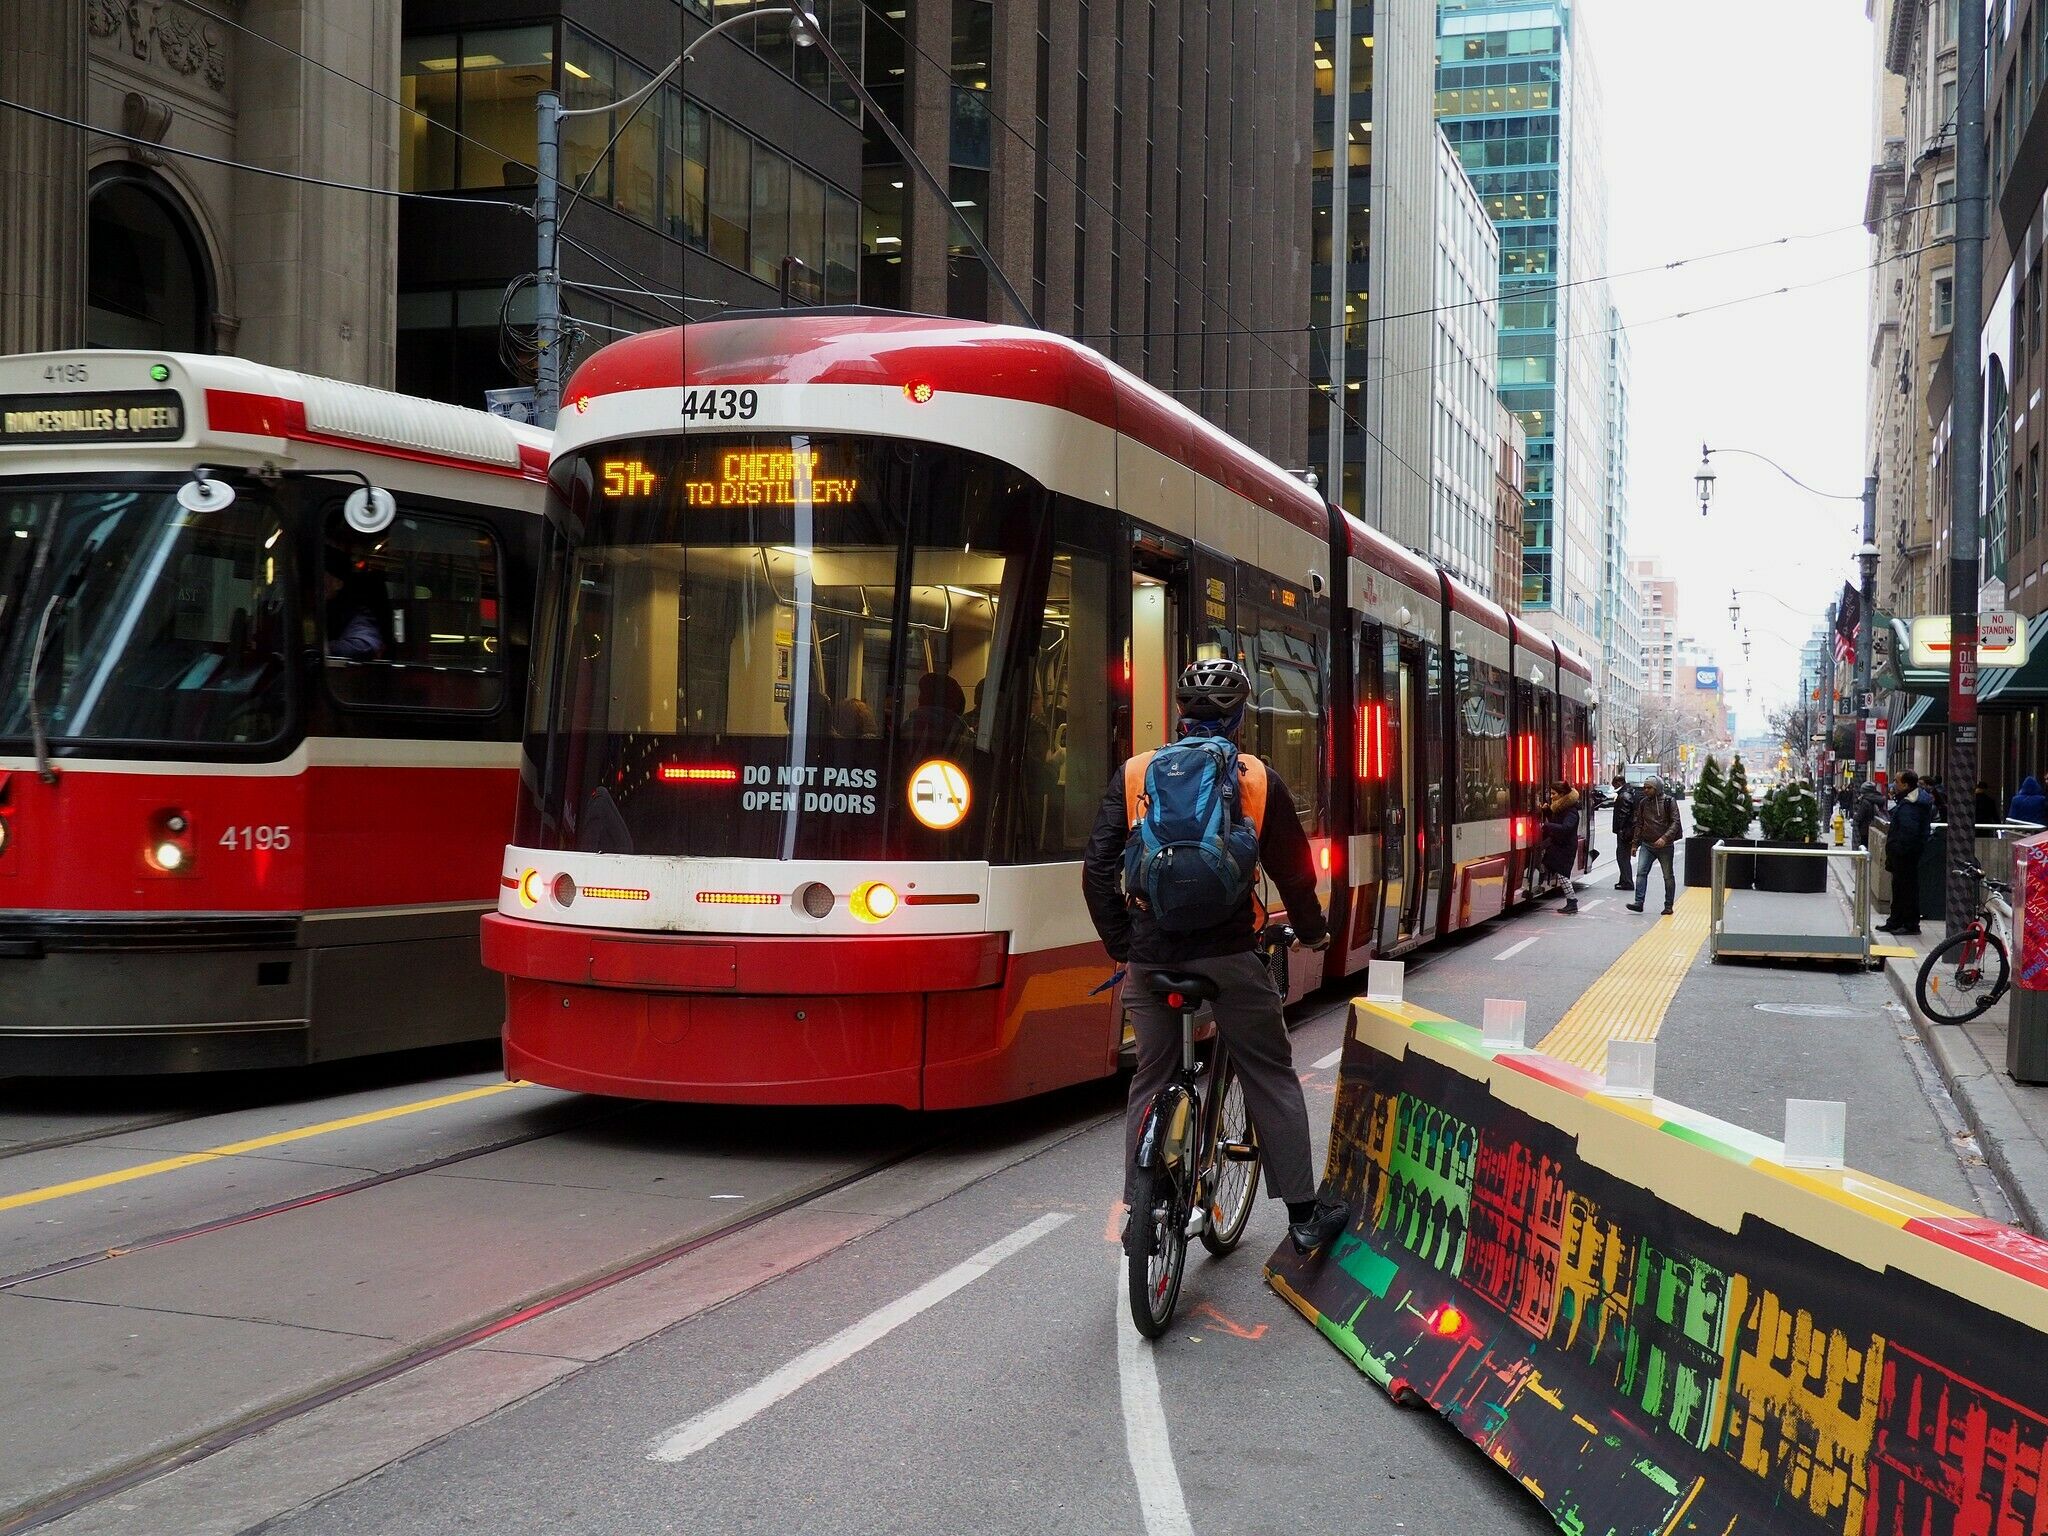
Last year, 45 people died walking or cycling on Toronto streets.
Launched in 2016, the City of Toronto’s Vision Zero Road Safety Plan is an ongoing effort to reduce — and ultimately eliminate — serious injuries and deaths on our streets by implementing various safety measures and redesigning roadways.
As frequent cyclists and pedestrians, Andrew, Evan and I care deeply about Vision Zero and what it represents. We’re keen to apply our tech skills to this literal life or death issue, to discover how we can use the traffic data the city collects to prevent tragedies, and help everyone, especially the most vulnerable road users feel safe on our streets.
To achieve this, we’ve spent the past five months learning how City staff are using decades worth of traffic data, and more importantly, how they’d like to be using it to further the goals of Vision Zero.
How is traffic data being used?
As a resident, you might have dialed 311 because you noticed an unsafe crossing area in your neighbourhood. Transportation staff take your request, go onsite, and use traffic volume and collision data as part of their evaluation of potential safety improvement to the street. Engineers can identify dangerous hot spots and take action through safety interventions like new mid-block signals or pedestrian crossovers, narrowed streets, speed humps to calm traffic, leading pedestrian intervals to increase pedestrian safety, flashing ‘Watch Your Speed’ signs, or ultimately even automated enforcement to make drivers slow down.
Vision Zero Planning, a team focused on the six emphasis areas outlined in the safety plan, looks at how those structural changes to our streets can privilege more vulnerable road users and how data can help make those proactive decisions. Pedestrian Projects and Cycling Infrastructure use the traffic and collision data to frame umbrella strategies (like the 10-Year Cycling Plan), while City Planning staff use the data to determine the impact of new developments or major infrastructure projects on traffic flows.
Staff are deeply committed to their missions, but they’re hindered by the limitations of the City’s data tools. The current data management systems used by Transportation Services, dubbed CRASH for collision data and FLOW for traffic volume data, were built on a legacy Oracle database in the early 90s, and the applications are now, well… limited.
What’s the current user experience like?
Right now, staff are primarily using CRASH and FLOW to pull reports. Simply put, they can retrieve the data they need, but there’s not a lot of functionality to enable them to do things with that data, like compare historical counts, put it on a map, or see collision data and traffic volume data together at the same location.
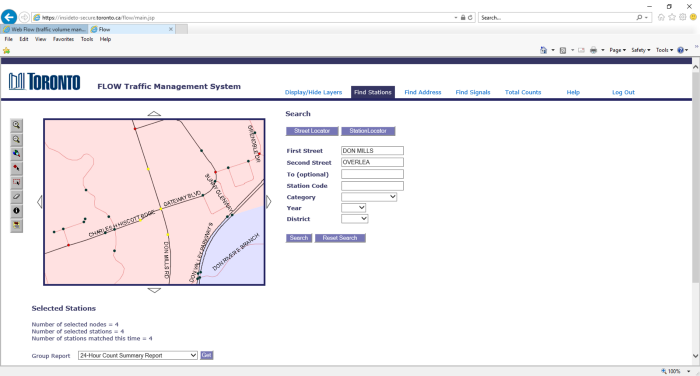
A desire we heard a lot was for a “one-stop shop” for pulling data and working with it. To understand what that might look like, we first needed to understand how users inside and outside of Transportation interact with collision and volume data.
In other words, we needed to dive deeper into user research.
We conducted 23 interviews across eight user groups. We spoke to data collection and analysis supervisors managing the transfer of data, support staff and mail clerks verifying the data, and engineers loading and using the data to recommend safety interventions. From there we met with users across departments like Traffic Operations, Pedestrian Projects, Cycling, City Planning, Vision Zero Planning, and Police Services.
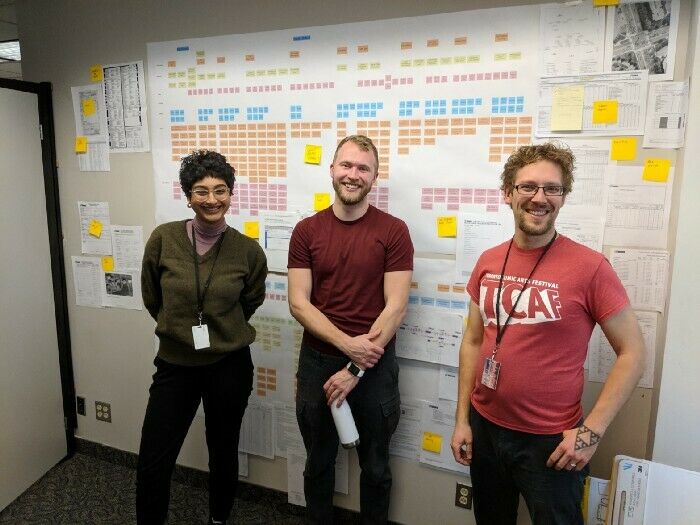
In parallel, Evan was conducting technical interviews with staff at the Geospatial Competency centre, Open Data, Big Data Innovation Team and Cloud Services to scope out the technical landscape, requirements, and constraints.
What did we learn?
There’s a real appreciation for the value of data across the city with a shift toward making data (barring personal information) public and available. People at the City really care about making data-driven decisions to make the streets safer. They also recognize that the way the current systems exist can be reimagined to engage internal staff, but also be used as a tool of discovery and exploration for the public since there’s so much historical data that has been collected within CRASH & FLOW. Though the mindset is positive and there’s a real desire for progression, we noticed some recurring patterns in our research.
1. Users don’t find data sources reliable (and making them reliable takes work)
When a non-fatal, or non-serious collision occurs (ie. a fender-bender), those involved are asked to self-report at Collision Reporting Centres. As you can imagine, the stories of those involved in collisions don’t always line up, and coding clerks at the Traffic Safety Unit said they often have to do some detective work to get the full “data” picture.
Users also expressed frustration verifying the data contained in the police reports that accompany more serious collisions. Privacy concerns mean some of the information is redacted, and the reports do not include officers’ field notes, which makes it difficult to verify and clean data.
“Each Motor Vehicle Accident Report is filled out mostly manually from field notes, and data problems we experience are largely because officers don’t then go back our digital record to update fields there.” -Police Traffic Services
The existing applications also leave room for users to create their own standards for entering data, which leads to errors, inconsistency and confusion. For example, North-South or East-West directions are often misrepresented or flipped.
Finally, different applications appear to calculate and catalogue speed — a major factor in the severity of collisions — differently.
“You have to take the speed data with a grain of salt.” -Traffic Ops Engineer
2. There’s an emphasis on repetitive, manual work across multiple applications to do a single task.
There’s no one stop shop for all the staff’s data needs. When using CRASH and FLOW, users are constantly context-switching. At the Traffic Safety Unit, there is no single tool to load, clean, verify and pull reports or queries.
“Right now, I’ve got four different windows open just to tell where we’re going with this count…now we’ve got six different windows open, all to do one request.”-Staff at Traffic Safety Unit
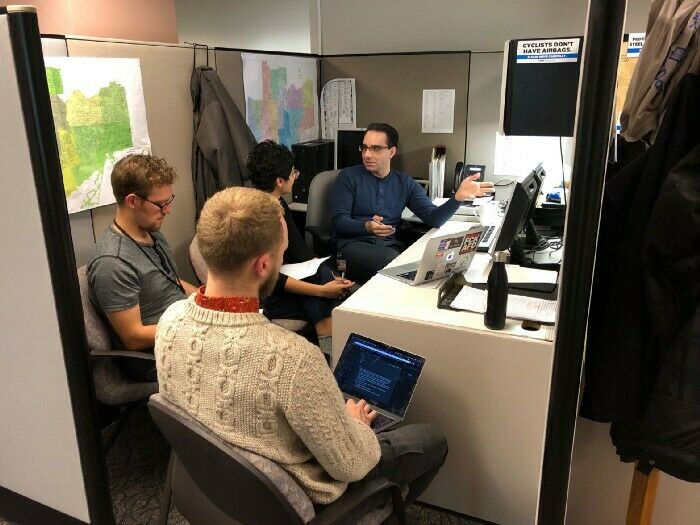
This is working at the moment, but there’s definitely room for improvement; even a small amount of automation could make this process much easier and efficient for staff.
3. There’s an opportunity to integrate more — and more diverse — data
Users of CRASH and FLOW are aware of data at the City that could help them, but these aren’t included in their databases. For example, Traffic Operation investigators do their own four-hour volume counts that are not available in FLOW. Similarly, pedestrian delay counts and comprehensive cycling counts are also absent in FLOW.
One of the pieces of data most frequently on users’ wish-lists was information about incidents that aren’t classified as motor vehicle collisions, things like cyclist doorings, or pedestrian near-misses, or video analytics of the moments prior to a collision are not included current CRASH data.
There was also a real desire across departments to move away from car-centric data, and incorporate more information about how everyone, from pedestrians to cyclists, seniors or those with mobility devices, use our roads.
Where do we go from here?
First up, we want to thank each and every public servant and stakeholder who made time to speak with us. Speaking with so many people who use CRASH and FLOW helped us truly understand pain points and identify opportunities.
Our user research has shown us that integrating CRASH and FLOW into a single data platform would have an immediate and significant impact for users. It will reduce both the amount of manual work involved in generating reports, and the opportunities to introduce human error into those reports.
We also learned that requesting information to assess a traffic warrant (internally referred to as “requesting a count”) is one of the most common queries to CRASH and FLOW. So we’re going to start with this process, and see how we can make it easier, simpler and more automated for Traffic Operations staff using the data to conduct investigations.
So, with those key findings in mind, we’ve transformed our previous problem statement into a product vision:
We believe that by building an integrated collision and volume data platform for Data Supervisors from the Traffic Safety Unit and the Engineers in Traffic Operations, we’ll achieve a seamless data request to traffic warrant process. We will increase access and extraction of data, cultivate trust in data sources, imbue transparency in the data pipeline, while continuing to work toward a shared vision of road safety for all.
During our next six-week sprint, we’ll be diving into the process of requesting data for a warrant. We’ll look look at both sides of the process: what Traffic Operations needs from the Data Collection Supervisor to request a count fand what the Data Collection Supervisor needs to process the request and collect the required data.
Throughout that process, we can tell if we’re going in the right direction by using our product vision as a compass. We want to build just enough to learn, to test with users, evolve our statement and experiment again; and we can’t wait to share the results with you!
The Code for Canada fellowship embeds product teams into government, where they work alongside public servants to build great digital services. To learn more about becoming a fellow, or hosting a team of fellows in your department, visit codefor.ca/fellowship.
End of articles list
